Let’s say you load the report for the last week. The FRT tab (First response time) shows you a value of 2 minutes.
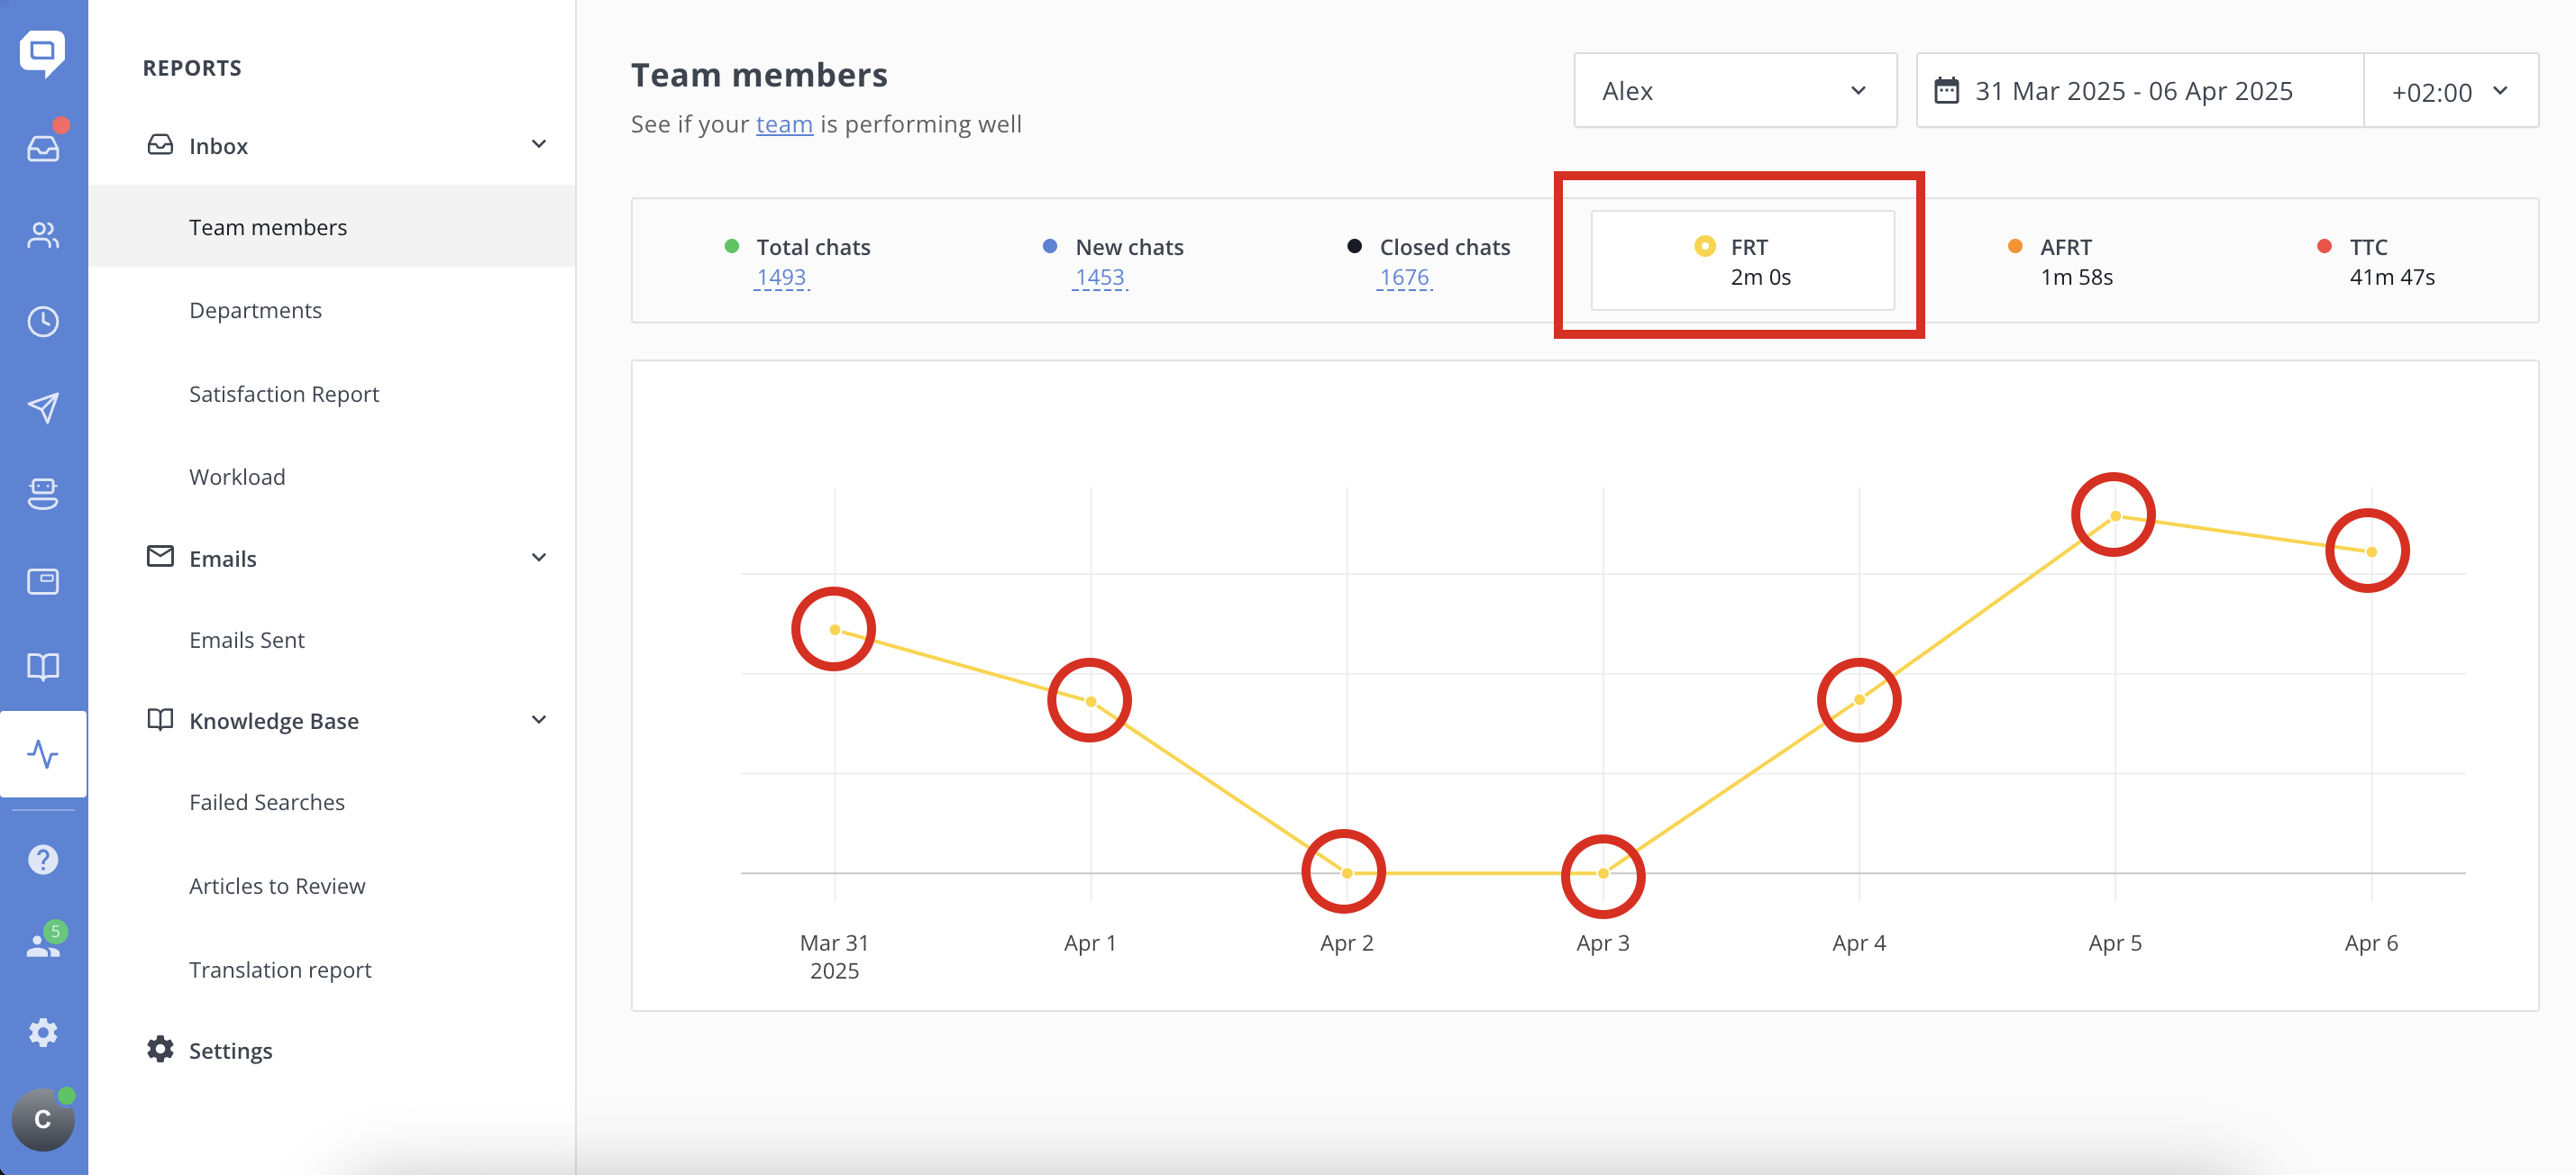
Then you look at the chart in that same report. It shows median values for each day. Let's say it's:
-
Day 1 – 5 min
-
Day 2 – 3 min
-
Day 3 – 1 min
-
Day 4 – 6 min
-
Day 5 – 1 min
-
Day 6 – 3 min
-
Day 7 – 0 minutes
If you arrange them in ascending order:
0, 1, 1, 3, 3, 5, 6The median of these daily medians is 3 minutes.
But that’s not how the report calculates the weekly FRT. The value of 2 minutes shown in the tab is based on all chats from the entire week, not just the daily summaries. It sorts the FRT values of every chat in that time range and then takes the true median of that full dataset.
In contrast, the chart aggregates per period (hour/day/week/month), depending on the selected range. So what you see on the chart is the median of a specific slice, not the full period.
More examples:
Example 1: Skewed data distribution
Let’s say on one day, you had only 2 chats:
-
Chat 1 – 1 min
-
Chat 2 – 20 min
The daily median would be (1 + 20)/2 = 10.5 minutes
But on another day, you had 100 chats, all answered in 2 minutes. The daily median would be 2 minutes.
Now if you average or recalculate the weekly median based on these daily medians:
-
Day 1 (few chats): 10.5 minutes
-
Day 2 (many chats): 2 minutes
Example 2: Inconsistent chat volume per day
-
Day 1 – 100 chats, median: 2 min
-
Day 2 – 5 chats, median: 6 min
-
Day 3 – 80 chats, median: 1.5 min
Trying to calculate a median from daily medians without weighting by volume ignores the fact that Day 1 and 3 had way more data. It gives equal weight to Day 2, which had very few chats but a higher median. That’s how false impressions form.
Are deleted chats counted in FRT metrics or not?
When displaying the value in the FRT (First Response Time) tab, it's generated based on the data available at the moment - deleted chats are excluded from this calculation.
However, if you look at the summarized bars in the chart, those do include deleted chats. This can lead to small discrepancies between the chart and the FRT tab, especially if chats were deleted after the period passed but before the report was viewed.
In summary:
The FRT tab uses all raw chat data to calculate a true median for the selected time range.
The chart shows periodic medians, helpful for spotting trends - but not suitable for manual averaging or comparison with the tab’s value.