Understanding Performance Report Metrics: Median Values
When reviewing performance reports, it’s essential to understand that the metrics displayed are represented as median values. This approach provides a more accurate and robust understanding of the data, especially in cases where outliers or extreme values might skew the results. Below, we explain what median values are and how they are calculated.
What is a Median Value?
The median is a statistical measure that represents the middle value in a sorted list of numbers. Unlike the average (or mean), which can be influenced by extremely high or low values, the median provides a central point that reflects the typical experience or performance in the dataset.
For example:
Consider the following set of numbers: 2, 4, 6, 8, and 100.
- The average of these numbers would be (2 + 4 + 6 + 8 + 100) / 5 = 24.
- The median, however, is 6, as it is the middle value when the numbers are arranged in ascending order.
Why Use Median Values in Performance Reports?
In performance metrics, extreme values (such as unusually high or low-performance instances) can distort the overall picture if the mean is used. By using the median, the report reflects a value that is more representative of the majority of cases, ensuring the data is:
-
Robust against outliers.
-
Representative of typical performance.
-
Fair for comparisons across different datasets.
How is the Median Calculated?
The process for calculating the median is as follows:
-
Sort the Data: Arrange all the data points in ascending order.
-
Identify the Middle Value:
- If the number of data points is odd, the median is the middle value
- If the number of data points is even, the median is the average of the two middle values.
Example 1: Odd Number of Data Points
Data: 3, 7, 8, 12, 14
-
Sorted: 3, 7, 8, 12, 14
-
Median: 8 (the third value in the sorted list)
Example 2: Even Number of Data Points
Data: 3, 7, 8, 12
-
Sorted: 3, 7, 8, 12
-
Median: (7 + 8) / 2 = 7.5
Aggregation of Median Values in Reports
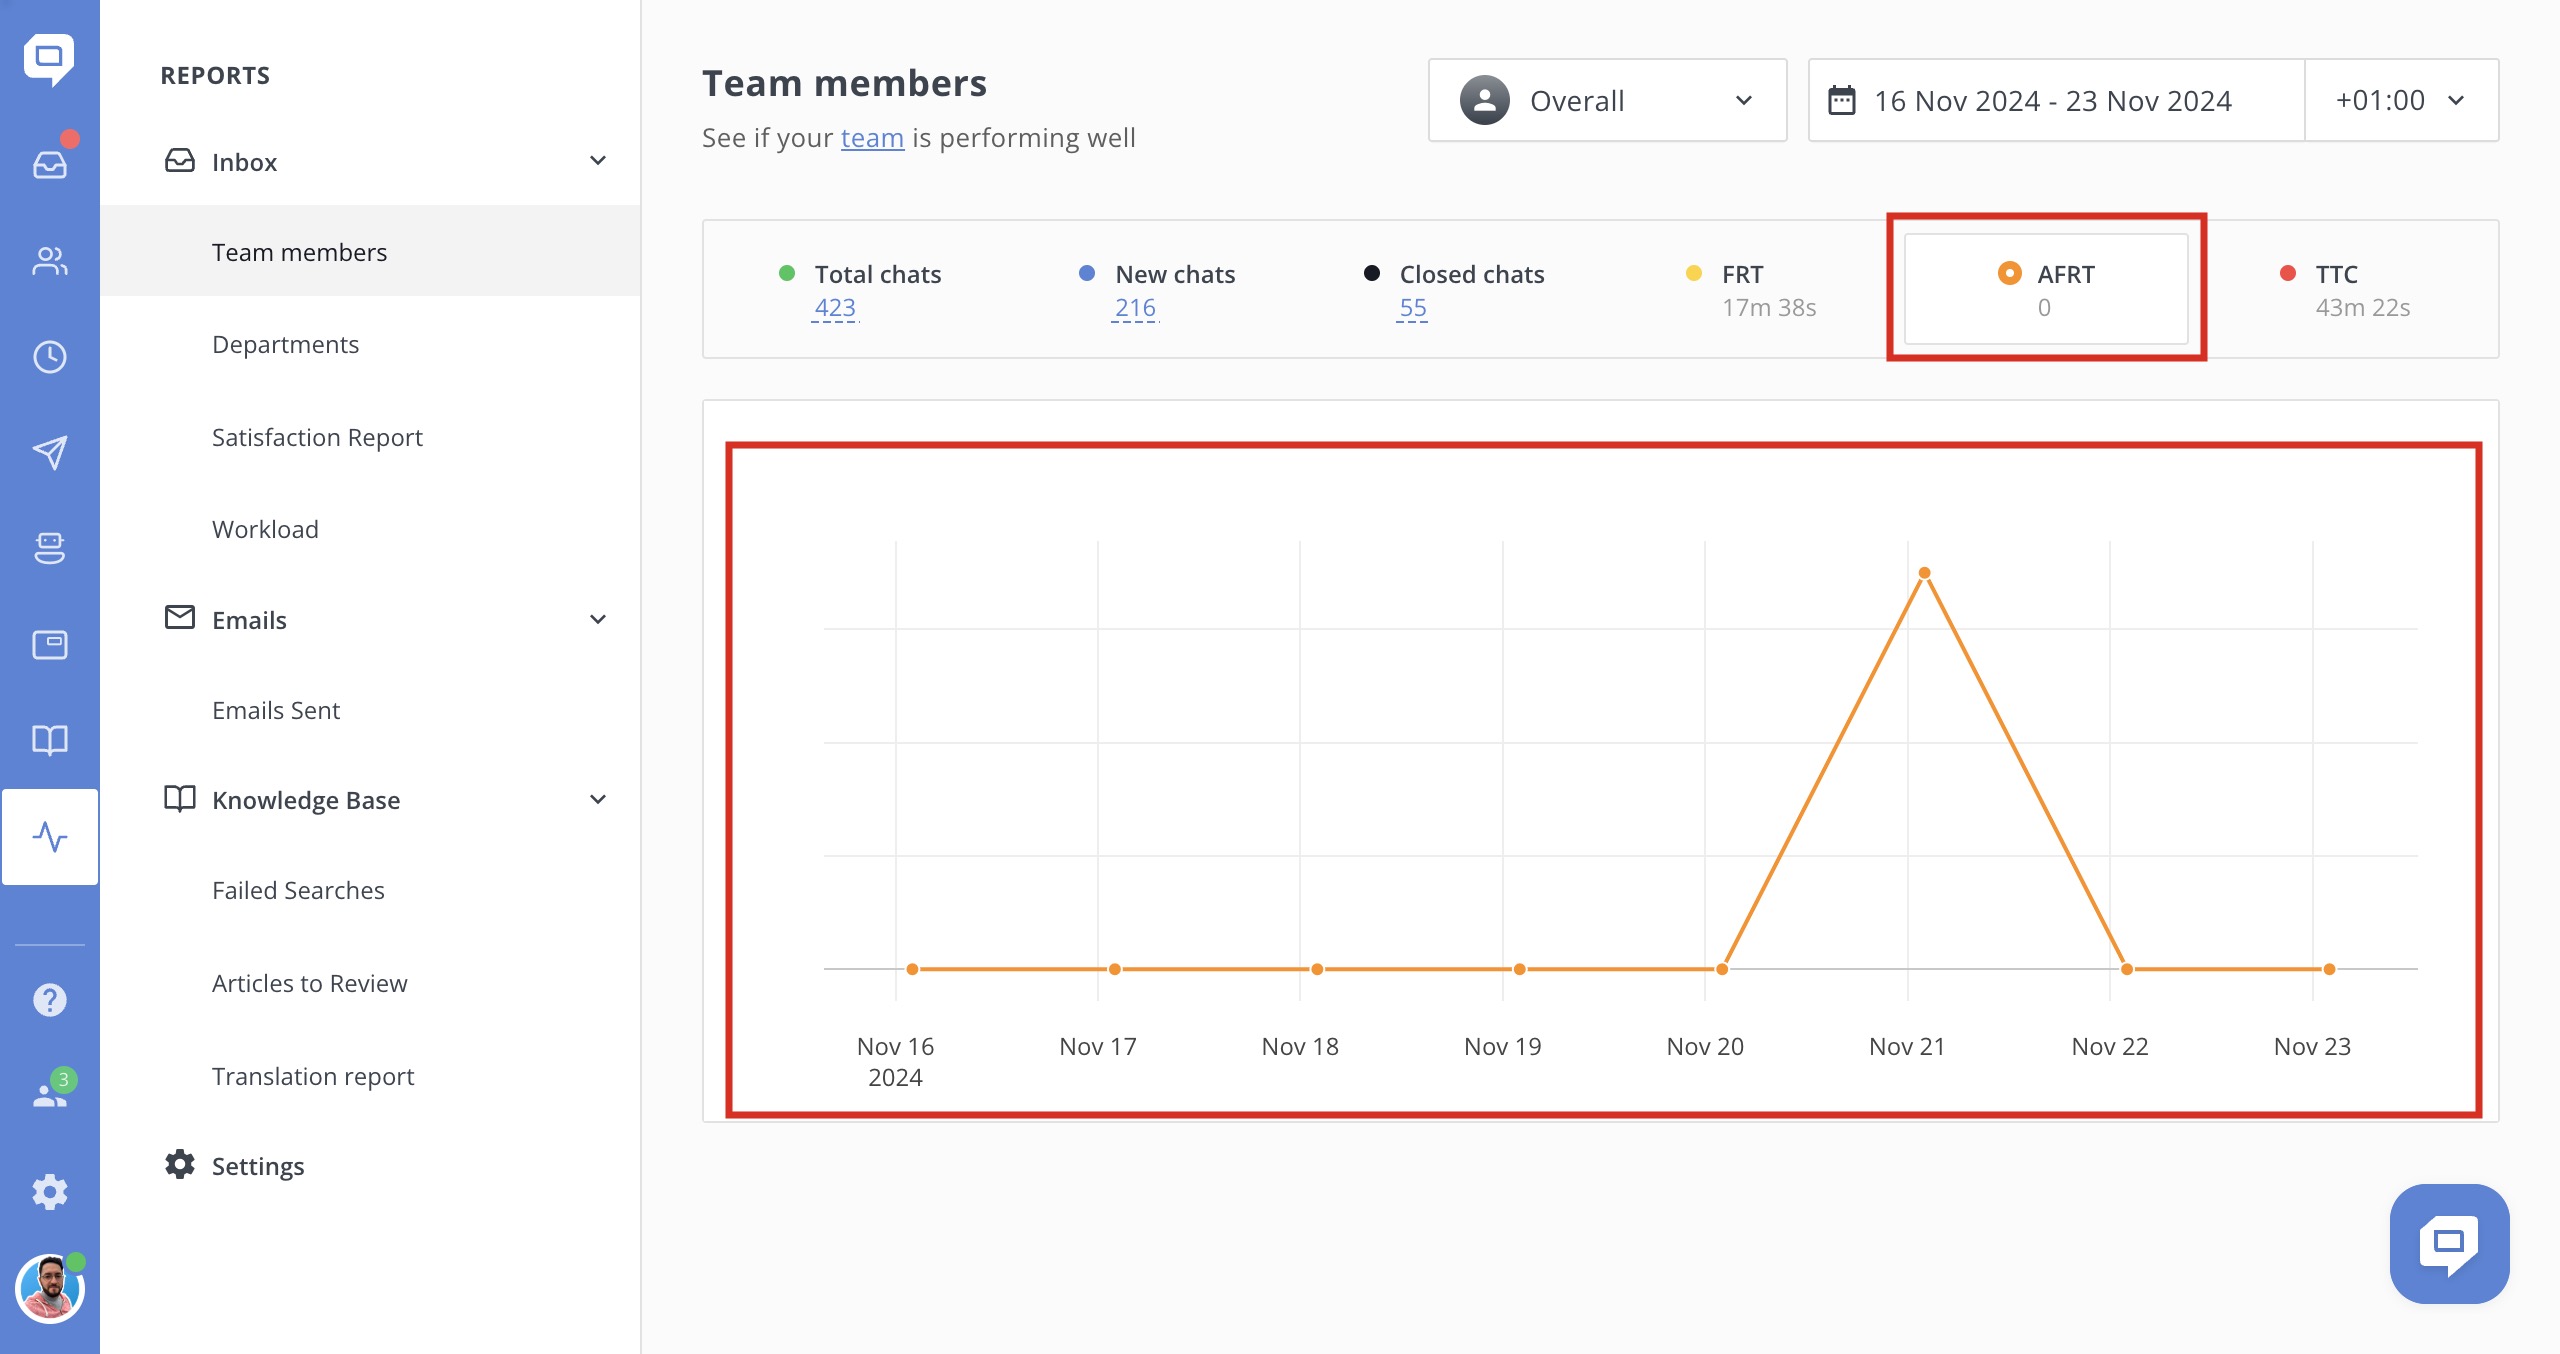
Performance reports for different time frames are generated by aggregating daily or weekly median values:
- Daily Reports: When loading a report for a day, the metrics are generated using the median values for each hour on that day.
-
Weekly Reports: When loading a report for a week, the metrics are generated using the median values for each day in that week.
-
Monthly Reports: generated from the median values for each week in that month.
- Annual Reports: generated from the median values for each month in that year, accordingly.

Thus, the following case may occur:
-
Chat №1 on Monday at 9:14 has AFRT - 0
-
Chat №2 on Monday at 9:15 has AFRT - 0
-
Chat №3 on Monday at 9:18 has AFRT - 0
-
Chat №4 on Monday at 10:05 has AFRT - 5
- Chat №5 on Monday at 10:07 has AFRT - 10
If you select reports for the entire day, the graph will show:
-
Monday 9:00-10:00, AFRT - 0
-
Monday 10:00-11:00, AFRT - 7.5
However, the total AFRT will be 0 because it is based on (0, 0, 0, 5, 10).
Summary
Using the median for performance metrics ensures that the data reflects the typical performance without being skewed by extreme values. Additionally, aggregating median values for daily, weekly, or monthly reports maintains consistency and accuracy, making it easier to interpret the results and make informed decisions based on the report.