Overview
HelpCrunch is built for real-time communication and seamless performance, but users may sometimes experience slow loading times. This guide provides a structured troubleshooting approach, covering common causes, fixes, and advanced diagnostics to resolve performance issues efficiently.
Understanding WebSockets and Their Role in HelpCrunch
HelpCrunch relies on WebSocket technology to maintain a persistent, real-time connection between your browser and our servers. Platforms like Facebook, Google Docs, and Slack also use WebSockets because they provide low-latency communication without the need for repeated HTTP requests.
Why WebSockets Are Important
- Persistent Connection – Unlike traditional HTTP requests, WebSockets keep a continuous connection open, reducing network overhead
- Low Latency – Messages are exchanged in real-time, improving response speed.
- Efficient Resource Usage – WebSockets eliminate redundant requests, minimizing bandwidth consumption.
- Bidirectional Communication – Both client and server can send messages anytime, making interactions instant.
Common Issues with WebSocket connection
Common Causes of Slow Loading
📶 Internet Connection Issues
- Unstable or weak Wi-Fi connection may cause performance issues, even if your speed test shows high Mbps.
- Distance from the router matters – even with strong signal, devices further from the router may struggle to send data back.
- Packet loss or high latency can lead to reconnections and slow page loading.
- Try using a different internet connection types. For example, turn on the mobile hotspot on your phone and connect a computer to check if the problem persist.
🖥️ Browser-related problems
- Outdated browsers may lack optimizations for WebSocket communication.
- Too many open tabs (multiple HelpCrunch inbox tabs) or resource-heavy extensions can slow down interactions.
🔐 Network Restrictions, Firewalls, Antivirus Software & VPN
- Corporate networks may throttle WebSocket connections.
- Firewalls & antivirus software can block WebSocket traffic.
- VPN can introduce latency or prevent WebSocket from functioning properly.
🗑️ Heavy Cached Data
- Old cache files and cookies can interfere with HelpCrunch loading properly.
.gif)
Step-by-Step Troubleshooting Guide
Check Your Internet Connection
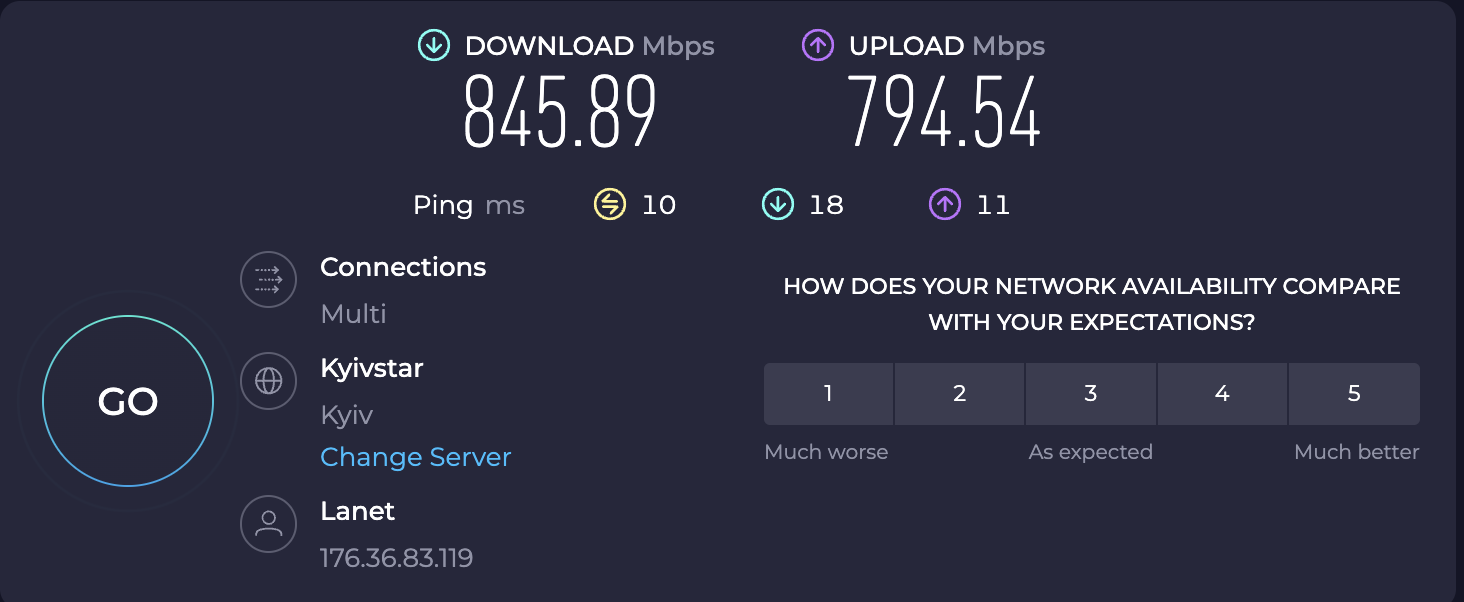
- Run an internet speed test (Speedtest)
- Select a test server in Germany, for example:
-
Open Speedtest.
-
Click "Change Server".
-
In the search bar, type "Germany" and select a server in Frankfurt or Berlin.
-
Start the test and note your ping, download, and upload speeds.
Refresh or Restart Your Browser
- Close unnecessary tabs and restart the browser.
- Use Google Chrome or Mozilla Firefox.
- Open HelpCrunch in an incognito/private browsing window to exclude the issue caused by the browser extensions.
Clear Cache, Cookies, and Local Storage properly
To fully clear the cache in Google Chrome and Mozilla Firefox:
-
Open the browser and press Ctrl + Shift + Delete (Windows) or Cmd + Shift + Delete (Mac).
-
Select "All Time" in the time range.
-
Check Cookies and Site Data, Cached Images and Files, and Site Settings. (We don`t recommend checking the Passwords and Autofill form data fields)
-
Click Delete Data and restart your browser.
.gif)
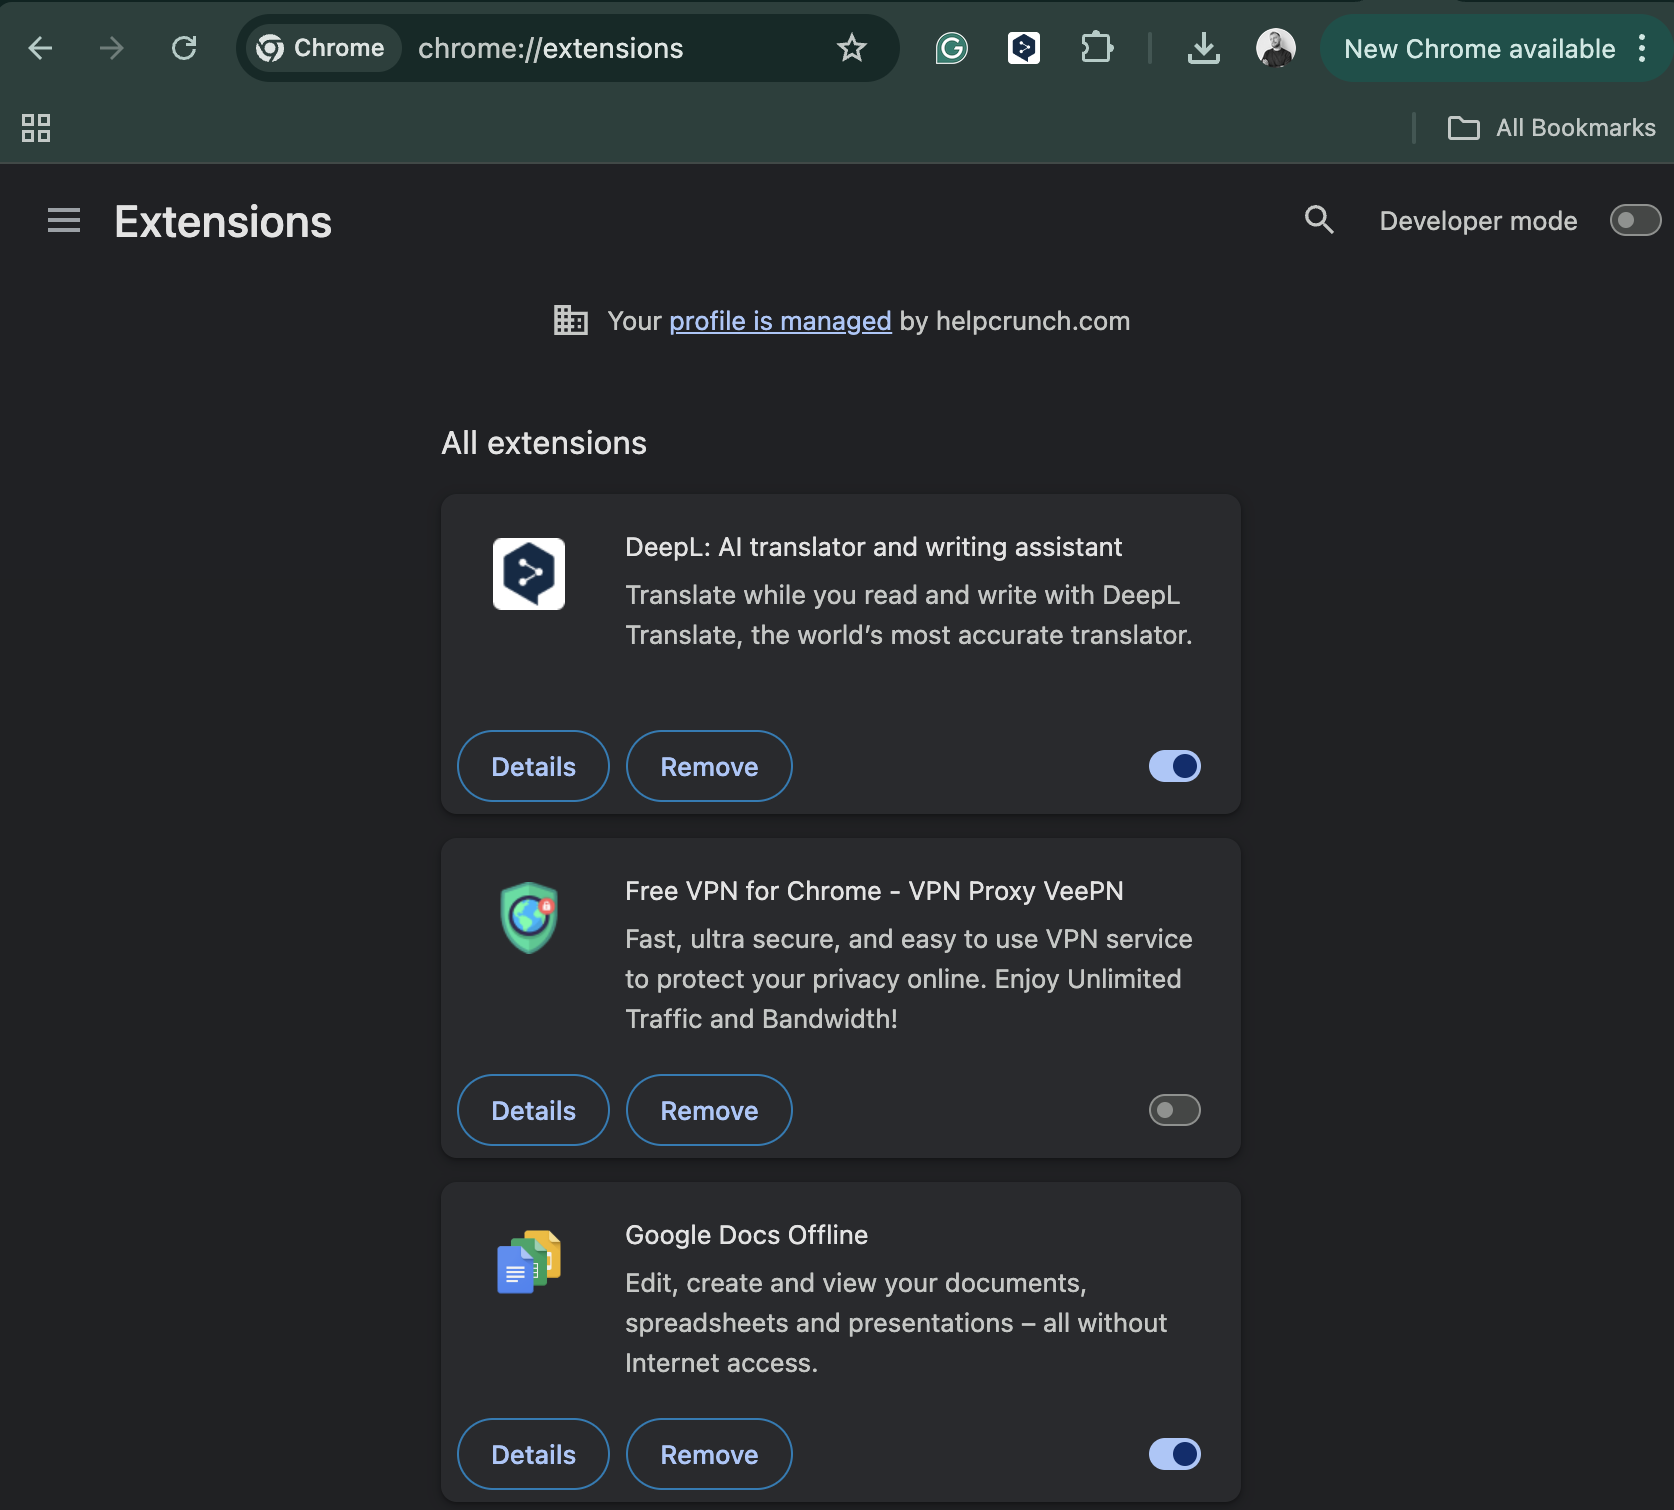
Disable Browser Extensions
- Some extensions (such as uBlock origin and security tools) may cause page not loading fully.
- Temporarily disable all extensions and test again.
How to disable extensions:
-
Open your browser (Google Chrome or Mozilla Firefox).
-
Enter the following address in the browser's address bar:
-
For Google Chrome: chrome://extensions/
-
For Mozilla Firefox: about:addons/
-
Press Enter to open the extensions management page.
-
Disable all extensions.
-
Refresh HelpCrunch and check performance
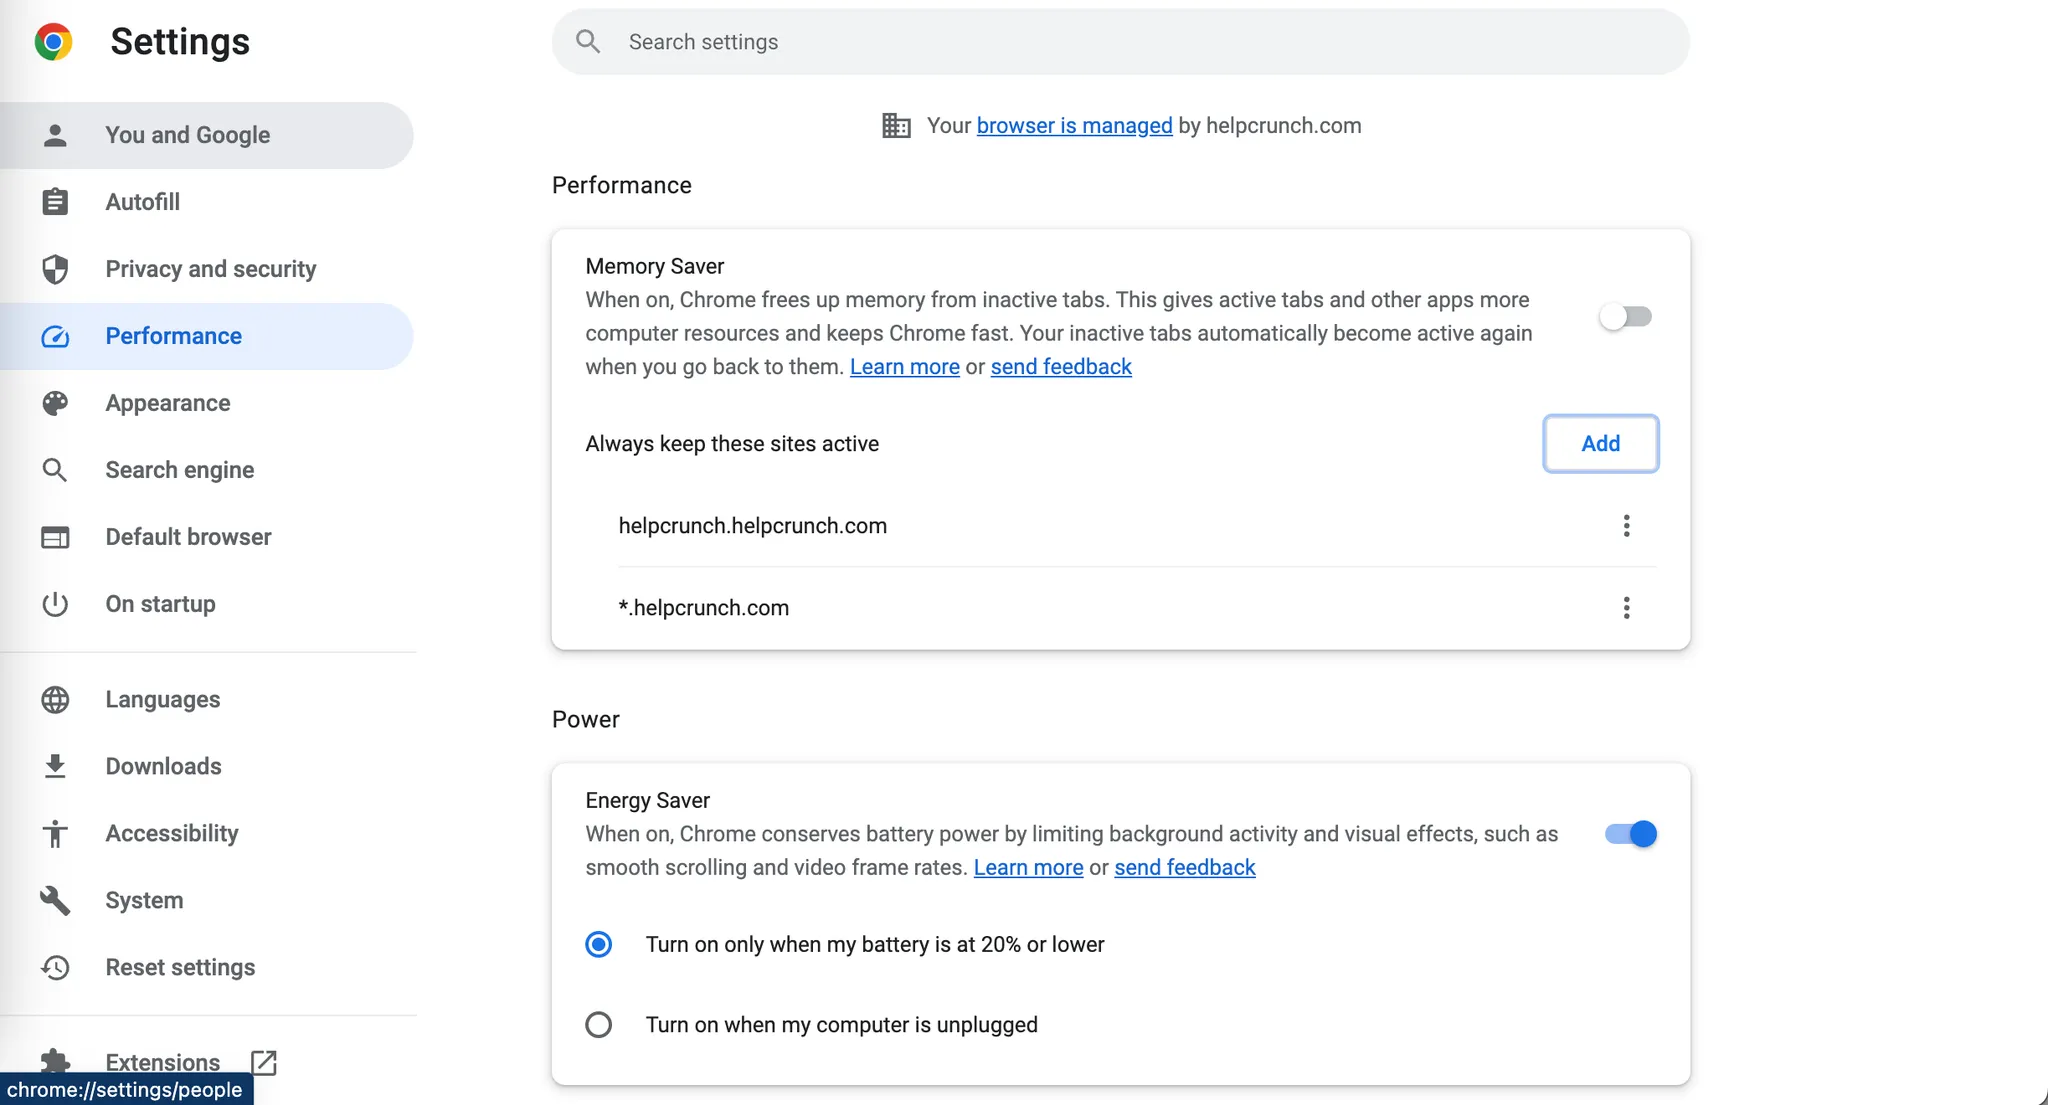
Adjust Power-Saving Settings in Browser
New browser versions may automatically suspend inactive tabs, which can disrupt WebSocket connections.
How to prevent this in Google Chrome:
-
Open Chrome Settings → Performance
-
Add Your_organization_name.helpcrunch.com to your exclusions list to keep it from falling asleep. (For example apple.helpcrunch.com)
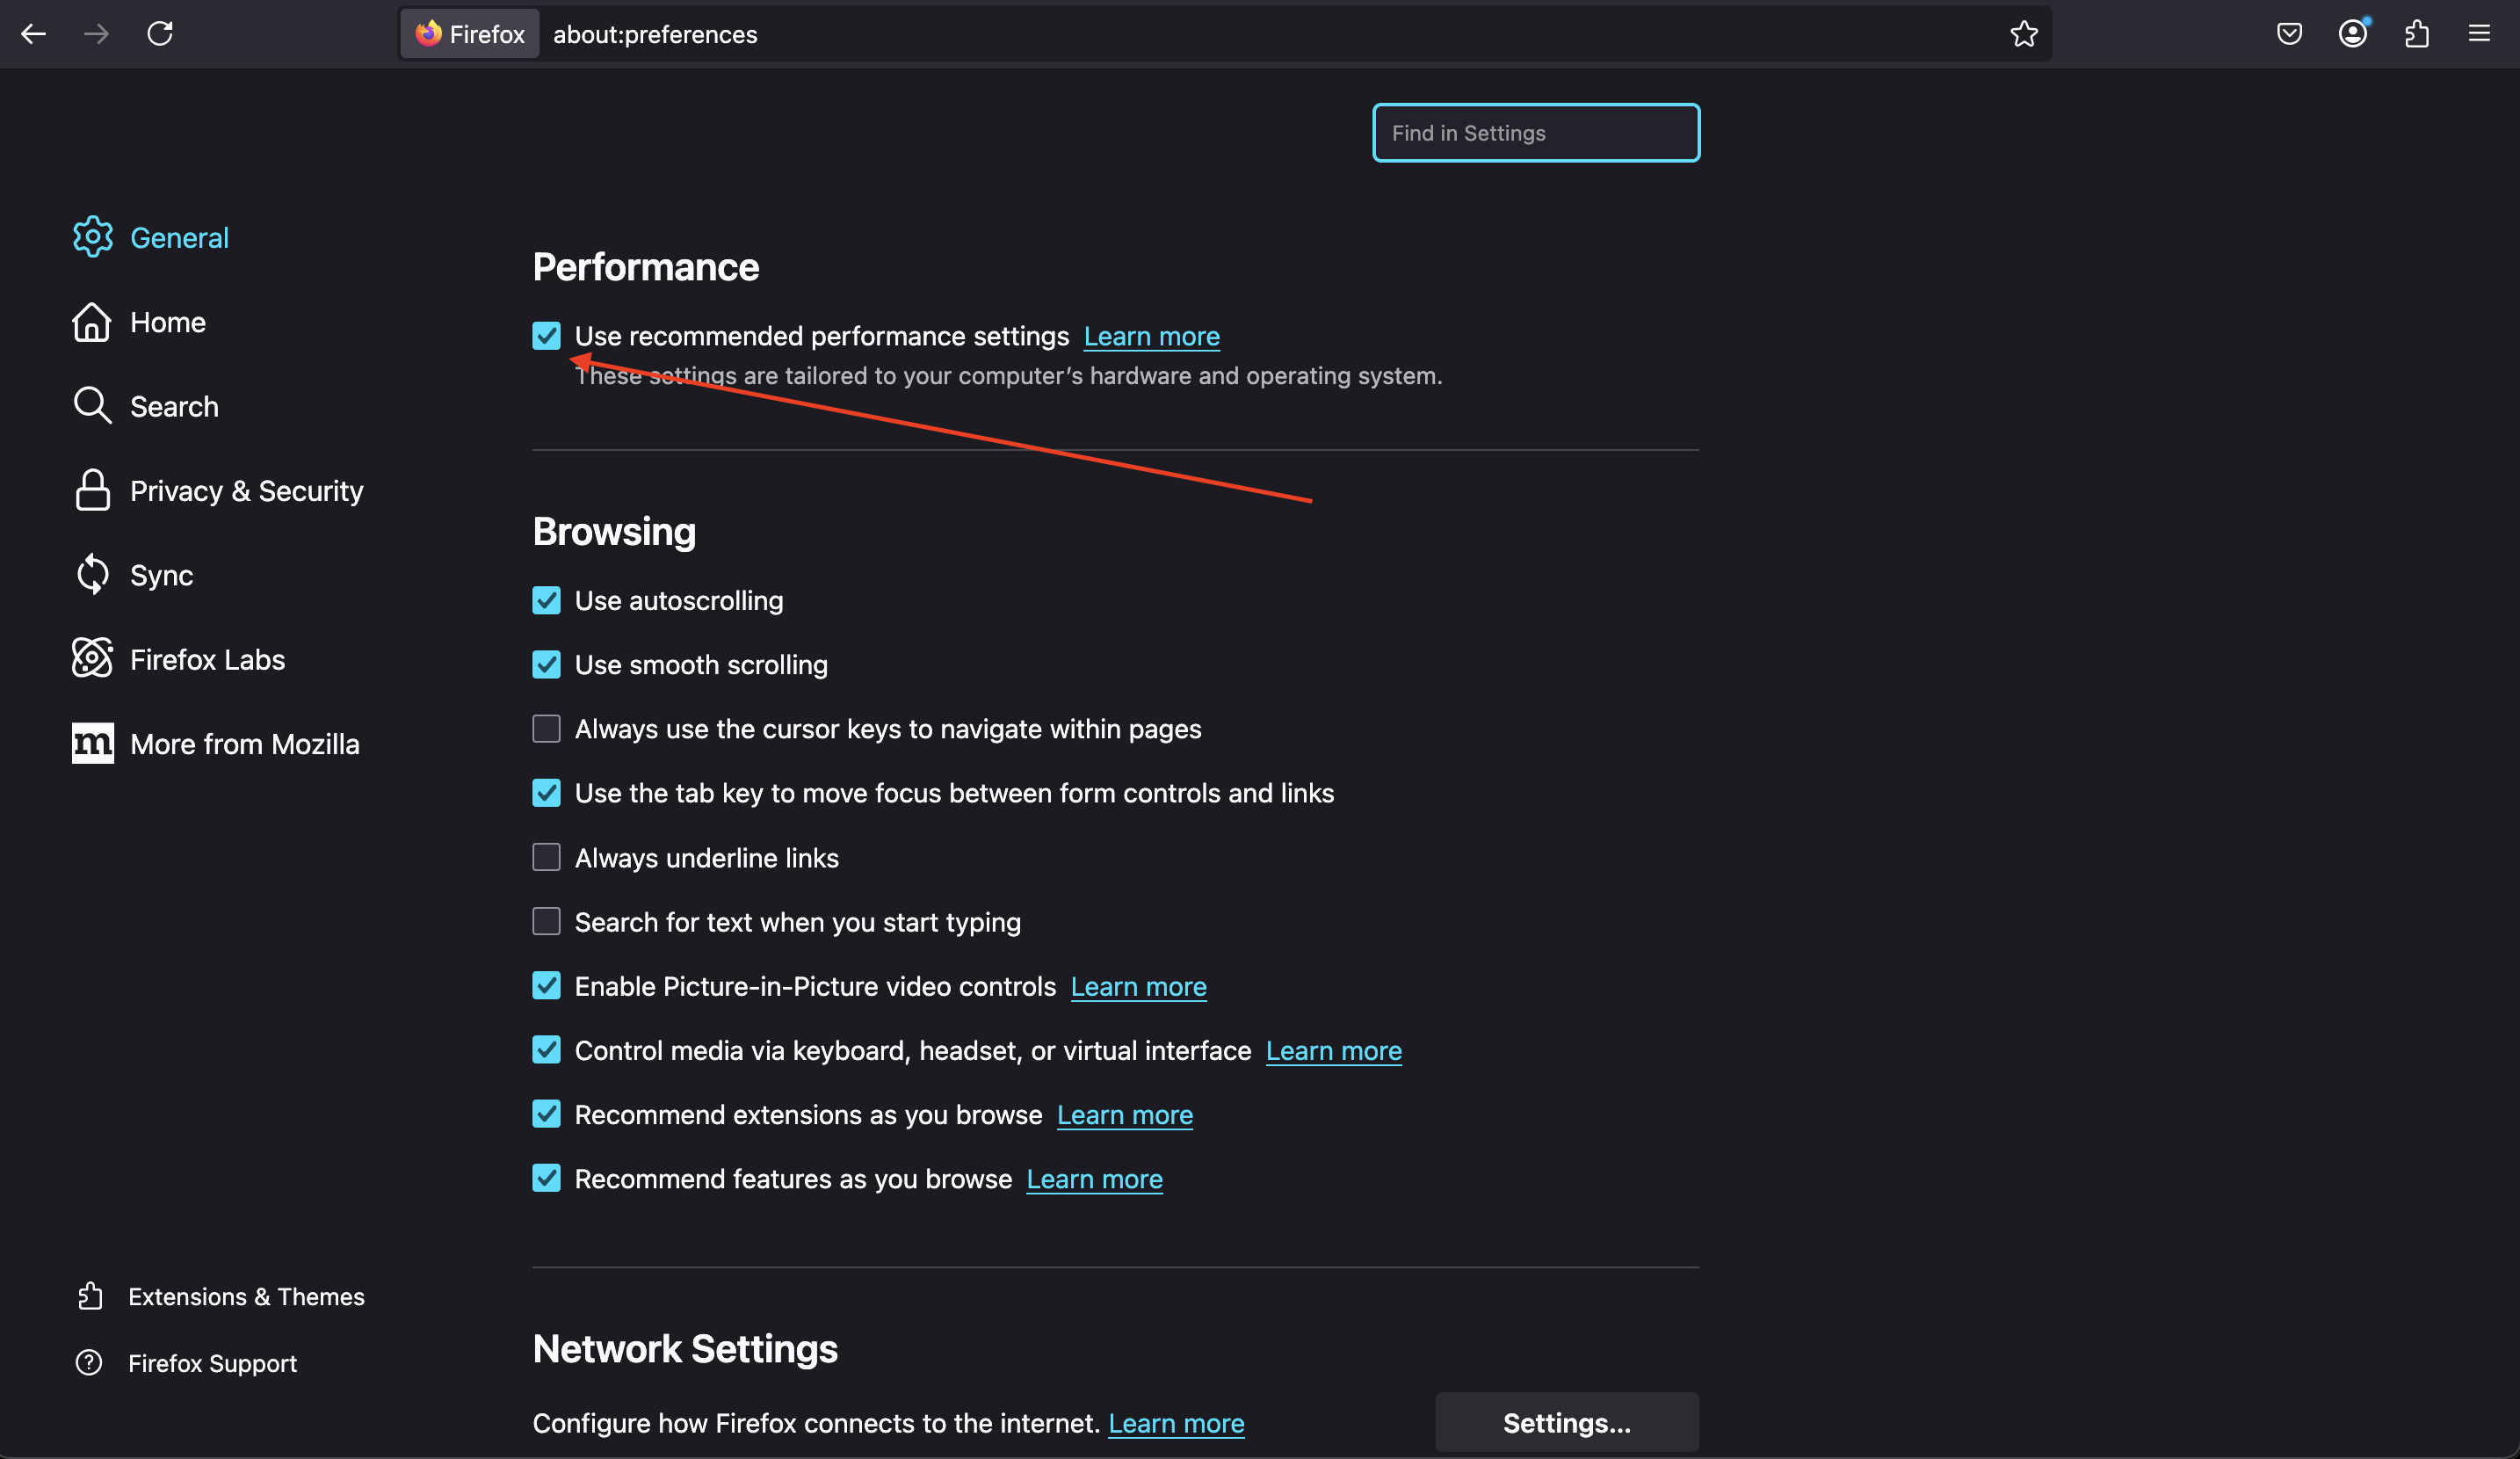
How to prevent this in Mozilla Firefox:
-
Open Firefox Settings → General
-
Scroll down to the Performance section.
-
Uncheck "Use recommended performance settings".
-
Disable "Enable automatic tab discarding" to prevent inactive tabs from being suspended.
Check for Errors in the Browser Console
How to open the Developer Console and check for errors:
Google Chrome:
-
Windows/Linux: Ctrl + Shift + J and switch to the Console tab at the top
-
Mac: Cmd + Option + J and switch to the Console tab at the top

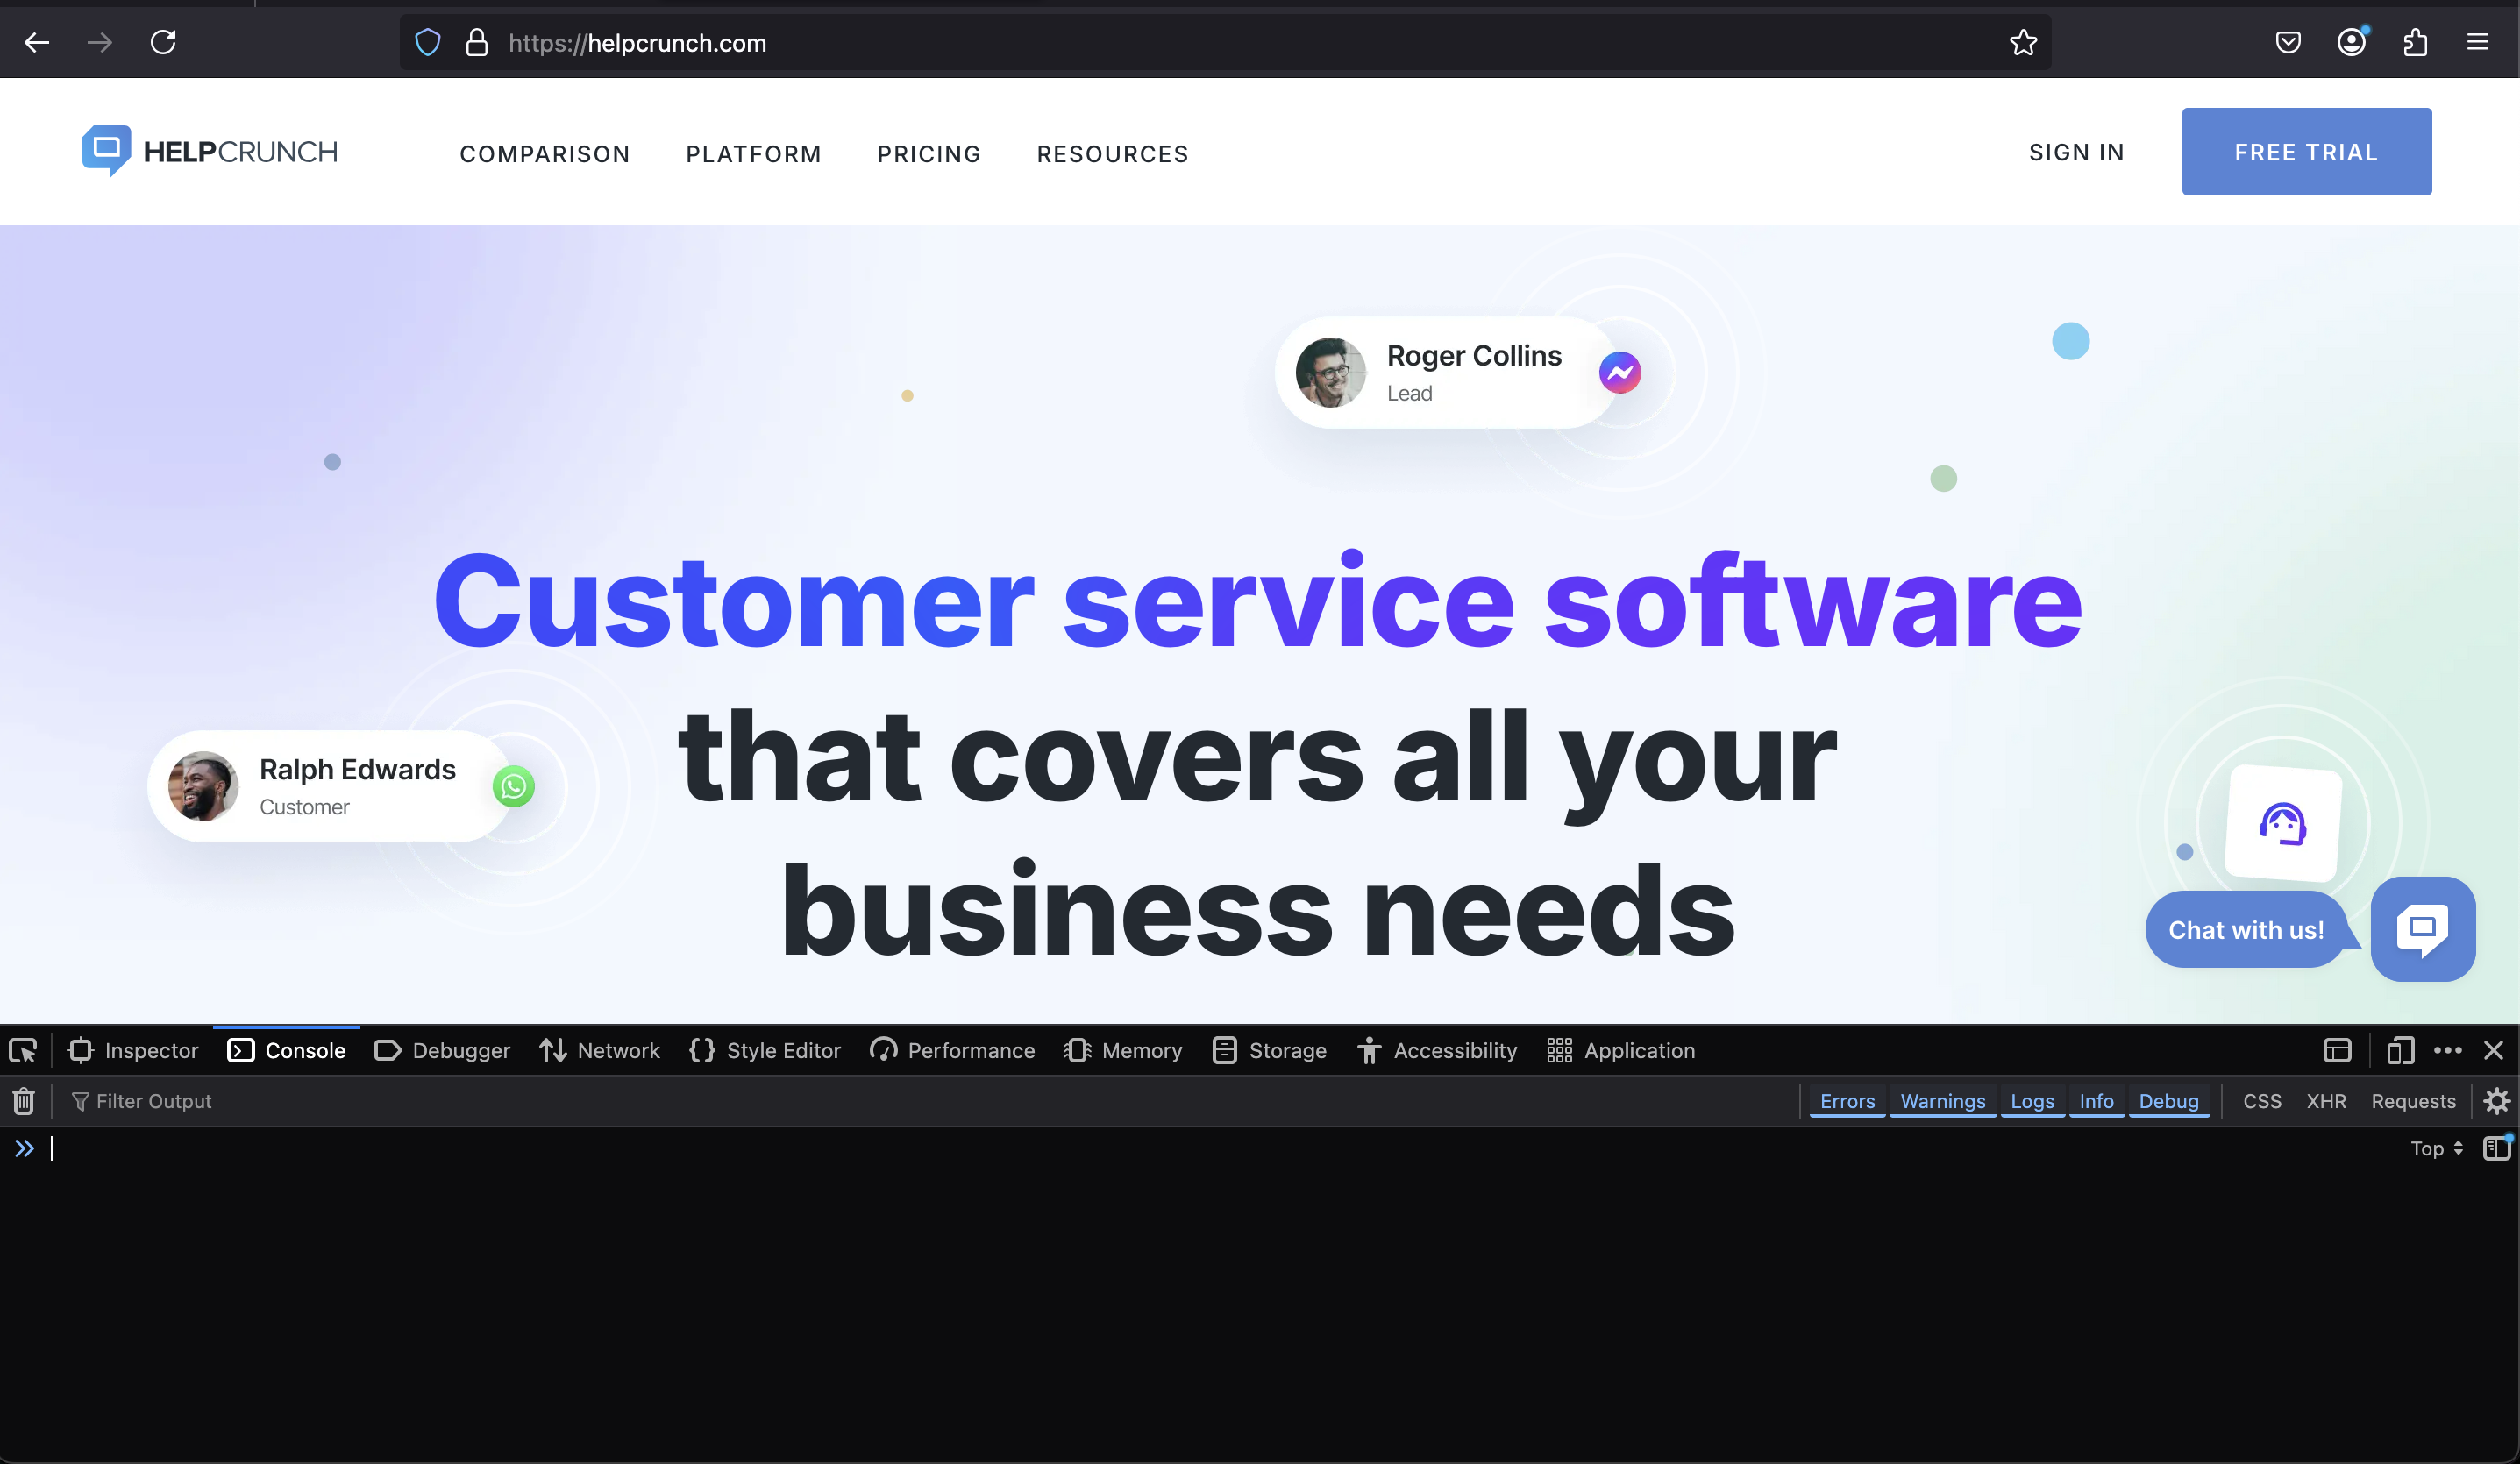
Mozilla Firefox:
-
Windows/Linux: Ctrl + Shift + K and switch to the Console tab at the top
-
Mac: Cmd + Option + K and switch to the Console tab at the top
Check the Network Tab for Slow or Failed Requests
Google Chrome:
-
Windows/Linux: Ctrl + Shift + J and switch to the Network tab at the top
-
Mac: Cmd + Option + J and switch to the Network tab at the top
Mozilla Firefox:
-
Windows/Linux: Ctrl + Shift + K and switch to the Network tab at the top
-
Mac: Cmd + Option + K and switch to the Network tab at the top
Steps to check network activity in both browsers:
-
After you navigate to the Network tab, reload the page (Ctrl + R or Cmd + R).
-
Wait for one minute. When the page is fully loaded, sort requests by 'Time' to identify the slowest ones.
-
Look for failed requests (marked in red) and click them to see details.
-
Take screenshots of slow and failed requests to share with support.
-min.gif)
Still having issues? Send collected above information with screenshots to the support team.
Additionally check if the issue affects all team members:
- Ask your team members if they are experiencing the same problem.
- If only one agent is affected, the instruction above should help to isolate the issue.
- If multiple agents are affected, collect the information according to the checklist below and send it to HelpCrunch support team
What information to collect when multiple team members are experiencing slow loading speeds:
- Internet Speed Test Results (Screenshot from Speedtest, using a server in Germany).
- Console Log Errors (From Developer Console)
- Network Tab Screenshot (Sorted by time)
- Active Inbox Name (Which inbox is affected).
- Detailed Description of the Issue:
- Is the HelpCrunch loading slowly or not loading at all?
-
Are there missing notifications?
-
How long does it take to load?
6. Screen Recording (If possible, record the issue happening).
Send all collected data directly in the HelpCrunch chat. The more details you provide, the faster we can diagnose and fix the issue! 🚀